Advanced Search: Build a Custom Dashboard
In the fields below, search for indicators by location, topics, population, classification, subgroup, or comparison. No fields are required, but we suggest selecting a location or two to start. In the additional search options section, select options to group and order search results. To learn more about how to customize a dashboard, see our help center.
Visit the Indicator List Page to see the full list of indicators and locations available on the site.
Search Results:
Indicator Gauge Icon Legend
Legend Colors
Red is bad, green is good, blue is not statistically different/neutral.
Compared to Distribution
 the value is in the best half of communities.
 the value is in the 2nd worst quarter of communities.
 the value is in the worst quarter of communities.
Compared to Target
 meets target;
  does not meet target.
Compared to a Single Value
 lower than the comparison value;
 higher than the comparison value;
 not statistically different from comparison value.
Trend

 non-significant change over time;
 significant change over time;
  no change over time.
Compared to Prior Value
 higher than the previous measurement period;
 lower than the previous measurement period;
 no statistically different change from previous measurement period.
Health / Alcohol & Drug Use
Health / Alcohol & Drug Use
County: Virginia Beach City, VA
Value
Compared to:
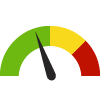
County: Virginia Beach City, VA Age-Adjusted Hospitalization Rate due to Adult Alcohol Use
County: Virginia Beach City, VA Age-Adjusted Hospitalization Rate due to Adult Alcohol Use
21.7
Hospitalizations per 10,000 population 18+ years
(2020-2022)
Compared to:


VA Counties
The distribution is based on data from 128 Virginia counties and county equivalents.
VA Value
(17.5)
The regional value is compared to the Virginia State value.
Prior Value
(20.1)
Prior Value compares a measured value with the previously measured value. Confidence intervals were taken into account in determining the direction of the comparison.
Trend
This comparison measures the indicator’s values over multiple time periods.<br>The Mann-Kendall Test for Statistical Significance is used to evaluate the trend<br>over 4 to 10 periods of measure, subject to data availability and comparability.
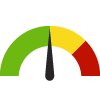
County: Virginia Beach City, VA Age-Adjusted Hospitalization Rate due to Substance Use
County: Virginia Beach City, VA Age-Adjusted Hospitalization Rate due to Substance Use
9.2
Hospitalizations per 10,000 population 18+ years
(2020-2022)
Compared to:
VA Counties
The distribution is based on data from 108 Virginia counties and county equivalents.
VA Value
(9.1)
The regional value is compared to the Virginia State value.
Prior Value
(8.7)
Prior Value compares a measured value with the previously measured value. Confidence intervals were taken into account in determining the direction of the comparison.
Trend
This comparison measures the indicator’s values over multiple time periods.<br>The Mann-Kendall Test for Statistical Significance is used to evaluate the trend<br>over 4 to 10 periods of measure, subject to data availability and comparability.
Health / Mental Health & Mental Disorders
Health / Mental Health & Mental Disorders
County: Virginia Beach City, VA
Value
Compared to:
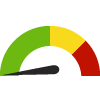
County: Virginia Beach City, VA Age-Adjusted Death Rate due to Suicide
County: Virginia Beach City, VA Age-Adjusted Death Rate due to Suicide
14.8
Deaths per 100,000 population
(2018-2020)
Compared to:

U.S. Counties
The distribution is based on data from 1,307 U.S. counties and county equivalents.
VA Value
(13.4)
The regional value is compared to the Virginia State value.
US Value
(13.9)
The regional value is compared to the national value.
Prior Value
(13.1)
Prior Value compares a measured value with the previously measured value. Confidence intervals were taken into account in determining the direction of the comparison.
Trend
This comparison measures the indicator’s values over multiple time periods.<br>The Mann-Kendall Test for Statistical Significance is used to evaluate the trend<br>over 4 to 10 periods of measure, subject to data availability and comparability.
HP 2030 Target
(12.8)
<div>MHMD-01: Reduce the suicide rate <strong>(LEADING HEALTH INDICATOR)</strong></div>
County: Virginia Beach City, VA Age-Adjusted Hospitalization Rate due to Adult Mental Health
County: Virginia Beach City, VA Age-Adjusted Hospitalization Rate due to Adult Mental Health
42.6
Hospitalizations per 10,000 population 18+ years
(2020-2022)
Compared to:
VA Counties
The distribution is based on data from 131 Virginia counties and county equivalents.
VA Value
(44.7)
The regional value is compared to the Virginia State value.
Prior Value
(44.5)
Prior Value compares a measured value with the previously measured value. Confidence intervals were taken into account in determining the direction of the comparison.
Trend
This comparison measures the indicator’s values over multiple time periods.<br>The Mann-Kendall Test for Statistical Significance is used to evaluate the trend<br>over 4 to 10 periods of measure, subject to data availability and comparability.
County: Virginia Beach City, VA Age-Adjusted Hospitalization Rate due to Adult Suicide and Intentional Self-inflicted Injury
County: Virginia Beach City, VA Age-Adjusted Hospitalization Rate due to Adult Suicide and Intentional Self-inflicted Injury
40.8
Hospitalizations per 10,000 population 18+ years
(2020-2022)
Compared to:
VA Counties
The distribution is based on data from 131 Virginia counties and county equivalents.
VA Value
(37.1)
The regional value is compared to the Virginia State value.
Prior Value
(44.9)
Prior Value compares a measured value with the previously measured value. Confidence intervals were taken into account in determining the direction of the comparison.
Trend
This comparison measures the indicator’s values over multiple time periods.<br>The Mann-Kendall Test for Statistical Significance is used to evaluate the trend<br>over 4 to 10 periods of measure, subject to data availability and comparability.
County: Virginia Beach City, VA Frequent Mental Distress
County: Virginia Beach City, VA Frequent Mental Distress
13.2%
(2019)
Compared to:

VA Counties
The distribution is based on data from 133 Virginia counties and county equivalents.
U.S. Counties
The distribution is based on data from 3,121 U.S. counties and county equivalents.
VA Value
(13.0%)
The regional value is compared to the Virginia State value.
US Value
(14.0%)
The regional value is compared to the national value.
Prior Value
(13.2%)
Prior Value compares a measured value with the previously measured value. Confidence intervals were taken into account in determining the direction of the comparison.
County: Virginia Beach City, VA Poor Mental Health: Average Number of Days
County: Virginia Beach City, VA Poor Mental Health: Average Number of Days
4.6
Days
(2021)
Compared to:
VA Counties
The distribution is based on data from 133 Virginia counties and county equivalents.
U.S. Counties
The distribution is based on data from 3,141 U.S. counties and county equivalents.
VA Value
(4.9)
The regional value is compared to the Virginia State value.
US Value
(4.8)
The regional value is compared to the national value.
Prior Value
(4.6)
Prior Value compares a measured value with the previously measured value. Confidence intervals were taken into account in determining the direction of the comparison.
Trend
This comparison measures the indicator’s values over multiple time periods.<br>The Mann-Kendall Test for Statistical Significance is used to evaluate the trend<br>over 4 to 10 periods of measure, subject to data availability and comparability.
