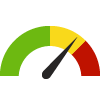
Indicator Gauge Icon Legend
Legend Colors
Red is bad, green is good, blue is not statistically different/neutral.
Compared to Distribution
 the value is in the best half of communities.
 the value is in the 2nd worst quarter of communities.
 the value is in the worst quarter of communities.
Compared to Target
 meets target;
  does not meet target.
Compared to a Single Value
 lower than the comparison value;
 higher than the comparison value;
 not statistically different from comparison value.
Trend

 non-significant change over time;
 significant change over time;
  no change over time.
Compared to Prior Value
 higher than the previous measurement period;
 lower than the previous measurement period;
 no statistically different change from previous measurement period.
 Significantly better than the overall value
 Significantly worse than the overall value
 No significant difference with the overall value
 No data on significance available
Age-Adjusted Hospitalization Rate due to Substance Use
This indicator is archived and is no longer being updated. Click to learn more
This indicator shows the age-adjusted hospitalization rate due to substance use disorders per 10,000 population aged 18 years and older. Substance-related disorders include the use, abuse, and dependence of opioids, cannabis, sedatives, hypnotics, anxiolytics, cocaine, other stimulants, hallucinogens, nicotine, inhalants, and other psychoactive substances. Cases of abuse of non-psychoactive substances, maternal care for (suspected) damage to fetus by drugs, and drug use complicating pregnancy, childbirth, and the puerperium are also included. Cases of alcohol-related disorders and poisoning due to intentional self-harm (if primary diagnosis) are excluded.
Why is this important?
Substance abuse is a major public health issue that has a strong impact on individuals, families, and communities. The use of illicit drugs, abuse of alcohol, and addiction to pharmaceuticals is linked to serious health conditions such as heart disease, cancer, and liver diseases, exacting over $600 billion annually in costs related to lost work productivity, healthcare, and crime. Substance abuse also contributes to a wide range of social, physical, mental, and public health problems such as teenage pregnancy, HIV/AIDs, STIs, domestic violence, child abuse, motor vehicle crashes, crime, homicide, and suicide. Because of these far-reaching consequences of substance abuse, treatment programs have been developed to counter addiction. In particular, a combination of behavioral therapy and treatment medications tailored to an individual's particular abusive pattern and other mental, emotional, or medical issues is suggested to help overcome addiction.
Clear this location
11.1
hospitalizations/ 10,000 population 18+ years
Source:
Virginia Health Information
Measurement period: 2020-2022
Maintained by: Conduent Healthy Communities Institute
Last update: March 2024
Measurement period: 2020-2022
Maintained by: Conduent Healthy Communities Institute
Last update: March 2024
Filter(s) for this location: Health District: Western Tidewater, Region: Greater Hampton Roads (MSA), Region: South Hampton Roads, State: Virginia
Compared to


Technical note: Rates were calculated using Claritas population estimates. Rates based on fewer than 12 hospitalizations or a population of less than 300 are not reported to ensure patient confidentiality.
More details:
Virginia Health Information (VHI) has provided non-confidential patient level information used in this analysis which was compiled in accordance with Virginia law. VHI has no authority to independently verify this data. By accepting this data the requester agrees to assume all risks that may be associated with or arise from the use of inaccurately submitted data. VHI edits data received and is responsible for the accuracy of assembling this information, but does not represent that the subsequent use of this data was appropriate or endorse or support any conclusions of inferences that may be drawn from the use of this data.
Graph Selections
Significantly better than the overall value
Significantly worse than the overall value
No significant difference with the overall value

hospitalizations per 10,000 population 18+ years
| County | Source | Measurement Period | Hospitalizations per 10,000 population 18+ years | |
|---|---|---|---|---|
There are 17 County values. The lowest value is 4.8, and the highest value is 23.6.
Half of the values are between 6.4 and 9.9.
The middle (median) value is 9.
Data Source
- Virginia Health Information
Maintained By: Conduent Healthy Communities Institute (Methodology)
Filed under: Health / Alcohol & Drug Use, Clinical Care, Adults