Search for Indicators
Education
Select a location below to see indicators for that location.
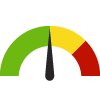
Indicator Gauge Icon Legend
Legend Colors
Red is bad, green is good, blue is not statistically different/neutral.
Compared to Distribution
 the value is in the best half of communities.
 the value is in the 2nd worst quarter of communities.
 the value is in the worst quarter of communities.
Compared to Target
 meets target;
  does not meet target.
Compared to a Single Value
 lower than the comparison value;
 higher than the comparison value;
 not statistically different from comparison value.
Trend

 non-significant change over time;
 significant change over time;
  no change over time.
Compared to Prior Value
 higher than the previous measurement period;
 lower than the previous measurement period;
 no statistically different change from previous measurement period.
County: Portsmouth City, VA
K-12 Indicators
Value
Compared to:
County: Portsmouth City, VA School Readiness at Kindergarten Entry
County: Portsmouth City, VA School Readiness at Kindergarten Entry
81.5%
(2019-2020)
Compared to:


VA Counties
The distribution is based on data from 129 Virginia counties and county equivalents.
VA Value
(84.3%)
The regional value is compared to the Virginia State value.
Prior Value
(80.0%)
Prior Value compares a measured value with the previously measured value. Confidence intervals were not taken into account in determining the direction of the comparison.
Trend
This comparison measures the indicator’s values over multiple time periods.<br>The Mann-Kendall Test for Statistical Significance is used to evaluate the trend<br>over 4 to 10 periods of measure, subject to data availability and comparability.
County: Portsmouth City, VA 3rd Grade Students Proficient in Reading
County: Portsmouth City, VA 3rd Grade Students Proficient in Reading
54.0%
(2022-2023)
Compared to:


VA Counties
The distribution is based on data from 130 Virginia counties, county equivalents, and county-city groups.
VA Value
(66.3%)
The regional value is compared to the Virginia State value.
Prior Value
(54.8%)
Prior Value compares a measured value with the previously measured value. Confidence intervals were not taken into account in determining the direction of the comparison.
Trend
This comparison measures the indicator’s values over multiple time periods.<br>The Mann-Kendall Test for Statistical Significance is used to evaluate the trend<br>over 4 to 10 periods of measure, subject to data availability and comparability.
County: Portsmouth City, VA 8th Grade Students Proficient in Math
County: Portsmouth City, VA 8th Grade Students Proficient in Math
50.2%
(2022-2023)
Compared to:
VA Counties
The distribution is based on data from 129 Virginia counties, county equivalents, and county-city groups.
VA Value
(68.3%)
The regional value is compared to the Virginia State value.
Prior Value
(53.1%)
Prior Value compares a measured value with the previously measured value. Confidence intervals were not taken into account in determining the direction of the comparison.
Trend
This comparison measures the indicator’s values over multiple time periods.<br>The Mann-Kendall Test for Statistical Significance is used to evaluate the trend<br>over 4 to 10 periods of measure, subject to data availability and comparability.
County: Portsmouth City, VA High School Graduation
County: Portsmouth City, VA High School Graduation
83.8%
(2023)
Compared to:

VA Counties
The distribution is based on data from 128 Virginia counties, county equivalents, and county-city groups.
VA Value
(91.9%)
The regional value is compared to the Virginia State value.
US Value
(86.5% in 2020)
The regional value is compared to the national value. The source for the national value is National Center for Education Statistics
Prior Value
(84.4%)
Prior Value compares a measured value with the previously measured value. Confidence intervals were not taken into account in determining the direction of the comparison.
Trend
This comparison measures the indicator’s values over multiple time periods.<br>The Mann-Kendall Test for Statistical Significance is used to evaluate the trend<br>over 4 to 10 periods of measure, subject to data availability and comparability.
HP 2030 Target
(90.7%)
County: Portsmouth City, VA Student-to-Teacher Ratio
County: Portsmouth City, VA Student-to-Teacher Ratio
14.1
Students per teacher
(2022-2023)
Compared to:


VA Counties
The distribution is based on data from 130 Virginia counties and county equivalents.
U.S. Counties
The distribution is based on data from 3,125 U.S. counties and county equivalents.
VA Value
(13.6)
The regional value is compared to the Virginia State value.
US Value
(15.4)
The regional value is compared to the national value.
Prior Value
(14.3)
Prior Value compares a measured value with the previously measured value. Confidence intervals were not taken into account in determining the direction of the comparison.
Trend
This comparison measures the indicator’s values over multiple time periods.<br>The Mann-Kendall Test for Statistical Significance is used to evaluate the trend<br>over 4 to 10 periods of measure, subject to data availability and comparability.
County: Portsmouth City, VA
Higher Education
Value
Compared to:
County: Portsmouth City, VA People 25+ with a Bachelor's Degree or Higher
County: Portsmouth City, VA People 25+ with a Bachelor's Degree or Higher
21.2%
(2018-2022)
Compared to:
VA Counties
The distribution is based on data from 133 Virginia counties and county equivalents.
U.S. Counties
The distribution is based on data from 3,133 U.S. counties and county equivalents.
VA Value
(41.0%)
The regional value is compared to the Virginia State value.
US Value
(34.3%)
The regional value is compared to the national value.
Trend
This comparison measures the indicator’s values over multiple time periods.<br>The Mann-Kendall Test for Statistical Significance is used to evaluate the trend<br>over 4 to 10 periods of measure, subject to data availability and comparability.
County: Portsmouth City, VA People 25+ with a High School Diploma or Higher
County: Portsmouth City, VA People 25+ with a High School Diploma or Higher
89.5%
(2018-2022)
Compared to:
VA Counties
The distribution is based on data from 133 Virginia counties and county equivalents.
U.S. Counties
The distribution is based on data from 3,133 U.S. counties and county equivalents.
VA Value
(91.1%)
The regional value is compared to the Virginia State value.
US Value
(89.1%)
The regional value is compared to the national value.
Trend
This comparison measures the indicator’s values over multiple time periods.<br>The Mann-Kendall Test for Statistical Significance is used to evaluate the trend<br>over 4 to 10 periods of measure, subject to data availability and comparability.
