Search for Indicators

National Women's Health Week
Indicator Gauge Icon Legend
Legend Colors
Red is bad, green is good, blue is not statistically different/neutral.
Compared to Distribution
 the value is in the best half of communities.
 the value is in the 2nd worst quarter of communities.
 the value is in the worst quarter of communities.
Compared to Target
 meets target;
  does not meet target.
Compared to a Single Value
 lower than the comparison value;
 higher than the comparison value;
 not statistically different from comparison value.
Trend

 non-significant change over time;
 significant change over time;
  no change over time.
Compared to Prior Value
 higher than the previous measurement period;
 lower than the previous measurement period;
 no statistically different change from previous measurement period.
 Significantly better than the overall value
 Significantly worse than the overall value
 Significantly different than the overall value
 No significant difference with the overall value
 No data on significance available
Region: South Hampton Roads
Health / Disabilities
Value
Compared to:
Region: South Hampton Roads Children with a Disability
Region: South Hampton Roads Children with a Disability
5.0%
(2017-2021)
Compared to:


VA Value
(4.4%)
The regional value is compared to the Virginia State value.
US Value
(4.4%)
The regional value is compared to the national value.
Trend
This comparison measures the indicator’s values over multiple time periods.<br>The Mann-Kendall Test for Statistical Significance is used to evaluate the trend<br>over 4 to 10 periods of measure, subject to data availability and comparability.
Region: South Hampton Roads Persons with a Disability
Region: South Hampton Roads Persons with a Disability
12.7%
(2018-2022)
Compared to:

VA Value
(12.1%)
The regional value is compared to the Virginia State value.
US Value
(12.9%)
The regional value is compared to the national value.
Trend
This comparison measures the indicator’s values over multiple time periods.<br>The Mann-Kendall Test for Statistical Significance is used to evaluate the trend<br>over 4 to 10 periods of measure, subject to data availability and comparability.
Region: South Hampton Roads
Health / Health Care Access & Quality
Value
Compared to:
Region: South Hampton Roads Adults with Health Insurance: 18-64
Region: South Hampton Roads Adults with Health Insurance: 18-64
91.2%
(2021)
Compared to:
VA Counties
The distribution is based on data from 133 Virginia counties and county equivalents.
U.S. Counties
The distribution is based on data from 3,140 U.S. counties and county equivalents.
VA Value
(90.7%)
The regional value is compared to the Virginia State value.
Prior Value
(89.8%)
Prior Value compares a measured value with the previously measured value. Confidence intervals were not taken into account in determining the direction of the comparison.
Trend
This comparison measures the indicator’s values over multiple time periods.<br>The Mann-Kendall Test for Statistical Significance is used to evaluate the trend<br>over 4 to 10 periods of measure, subject to data availability and comparability.
Region: South Hampton Roads
Health / Older Adults
Value
Compared to:
Region: South Hampton Roads Adults 65+ with a Disability
Region: South Hampton Roads Adults 65+ with a Disability
33.0%
(2018-2022)
Compared to:

VA Value
(31.9%)
The regional value is compared to the Virginia State value.
US Value
(33.3%)
The regional value is compared to the national value.
Trend
This comparison measures the indicator’s values over multiple time periods.<br>The Mann-Kendall Test for Statistical Significance is used to evaluate the trend<br>over 4 to 10 periods of measure, subject to data availability and comparability.
Region: South Hampton Roads
Community / Transportation
Value
Compared to:
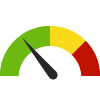
Region: South Hampton Roads Mean Travel Time to Work
Region: South Hampton Roads Mean Travel Time to Work
24.5
Minutes
(2018-2022)
Compared to:

VA Counties
The distribution is based on data from 133 Virginia counties and county equivalents.
U.S. Counties
The distribution is based on data from 3,131 U.S. counties and county equivalents.
VA Value
(27.9)
The regional value is compared to the Virginia State value.
US Value
(26.7)
The regional value is compared to the national value.
Trend
This comparison measures the indicator’s values over multiple time periods.<br>The Mann-Kendall Test for Statistical Significance is used to evaluate the trend<br>over 4 to 10 periods of measure, subject to data availability and comparability.
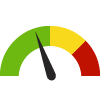
Region: South Hampton Roads Workers Commuting by Public Transportation
Region: South Hampton Roads Workers Commuting by Public Transportation
1.2%
(2018-2022)
Compared to:


VA Counties
The distribution is based on data from 133 Virginia counties and county equivalents.
U.S. Counties
(2015-2019)
The distribution is based on data from 3,142 U.S. counties and county equivalents.
VA Value
(3.0%)
The regional value is compared to the Virginia State value.
US Value
(3.8%)
The regional value is compared to the national value.
Trend
This comparison measures the indicator’s values over multiple time periods.<br>The Mann-Kendall Test for Statistical Significance is used to evaluate the trend<br>over 4 to 10 periods of measure, subject to data availability and comparability.
HP 2030 Target
(5.3%)
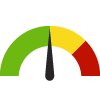
Region: South Hampton Roads Workers who Drive Alone to Work
Region: South Hampton Roads Workers who Drive Alone to Work
77.1%
(2018-2022)
Compared to:

VA Counties
The distribution is based on data from 133 Virginia counties and county equivalents.
U.S. Counties
The distribution is based on data from 3,133 U.S. counties and county equivalents.
VA Value
(70.9%)
The regional value is compared to the Virginia State value.
US Value
(71.7%)
The regional value is compared to the national value.
Trend
This comparison measures the indicator’s values over multiple time periods.<br>The Mann-Kendall Test for Statistical Significance is used to evaluate the trend<br>over 4 to 10 periods of measure, subject to data availability and comparability.
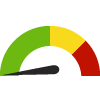
Region: South Hampton Roads Workers who Walk to Work
Region: South Hampton Roads Workers who Walk to Work
2.5%
(2018-2022)
Compared to:
VA Counties
The distribution is based on data from 133 Virginia counties and county equivalents.
U.S. Counties
The distribution is based on data from 3,133 U.S. counties and county equivalents.
VA Value
(2.1%)
The regional value is compared to the Virginia State value.
US Value
(2.4%)
The regional value is compared to the national value.
Trend
This comparison measures the indicator’s values over multiple time periods.<br>The Mann-Kendall Test for Statistical Significance is used to evaluate the trend<br>over 4 to 10 periods of measure, subject to data availability and comparability.
Region: South Hampton Roads
Economy / Poverty
Value
Compared to:
Region: South Hampton Roads Children Living Below 100% Poverty Level
Region: South Hampton Roads Children Living Below 100% Poverty Level
14.8%
(2018-2022)
Compared to:
VA Counties
The distribution is based on data from 133 Virginia counties and county equivalents.
U.S. Counties
The distribution is based on data from 3,132 U.S. counties and county equivalents.
VA Value
(12.8%)
The regional value is compared to the Virginia State value.
US Value
(16.7%)
The regional value is compared to the national value.
Trend
This comparison measures the indicator’s values over multiple time periods.<br>The Mann-Kendall Test for Statistical Significance is used to evaluate the trend<br>over 4 to 10 periods of measure, subject to data availability and comparability.
Region: South Hampton Roads People 65+ Living Below Poverty Level
Region: South Hampton Roads People 65+ Living Below Poverty Level
7.7%
(2018-2022)
Compared to:
VA Counties
The distribution is based on data from 133 Virginia counties and county equivalents.
U.S. Counties
The distribution is based on data from 3,133 U.S. counties and county equivalents.
VA Value
(8.0%)
The regional value is compared to the Virginia State value.
US Value
(10.0%)
The regional value is compared to the national value.
Trend
This comparison measures the indicator’s values over multiple time periods.<br>The Mann-Kendall Test for Statistical Significance is used to evaluate the trend<br>over 4 to 10 periods of measure, subject to data availability and comparability.
Region: South Hampton Roads People Living Below 100% Poverty Level
Region: South Hampton Roads People Living Below 100% Poverty Level
10.6%
(2018-2022)
Compared to:
VA Counties
The distribution is based on data from 133 Virginia counties and county equivalents.
U.S. Counties
The distribution is based on data from 3,133 U.S. counties and county equivalents.
VA Value
(10.0%)
The regional value is compared to the Virginia State value.
US Value
(12.5%)
The regional value is compared to the national value.
Trend
This comparison measures the indicator’s values over multiple time periods.<br>The Mann-Kendall Test for Statistical Significance is used to evaluate the trend<br>over 4 to 10 periods of measure, subject to data availability and comparability.
HP 2030 Target
(8.0%)
Region: South Hampton Roads Young Children Living Below Poverty Level
Region: South Hampton Roads Young Children Living Below Poverty Level
16.7%
(2018-2022)
Compared to:
VA Counties
The distribution is based on data from 133 Virginia counties and county equivalents.
U.S. Counties
The distribution is based on data from 3,131 U.S. counties and county equivalents.
VA Value
(13.9%)
The regional value is compared to the Virginia State value.
US Value
(18.1%)
The regional value is compared to the national value.
Trend
This comparison measures the indicator’s values over multiple time periods.<br>The Mann-Kendall Test for Statistical Significance is used to evaluate the trend<br>over 4 to 10 periods of measure, subject to data availability and comparability.
Region: South Hampton Roads
Education / Educational Attainment
Value
Compared to:
Region: South Hampton Roads People 25+ with a Bachelor's Degree or Higher
Region: South Hampton Roads People 25+ with a Bachelor's Degree or Higher
35.0%
(2018-2022)
Compared to:
VA Counties
The distribution is based on data from 133 Virginia counties and county equivalents.
U.S. Counties
The distribution is based on data from 3,133 U.S. counties and county equivalents.
VA Value
(41.0%)
The regional value is compared to the Virginia State value.
US Value
(34.3%)
The regional value is compared to the national value.
Trend
This comparison measures the indicator’s values over multiple time periods.<br>The Mann-Kendall Test for Statistical Significance is used to evaluate the trend<br>over 4 to 10 periods of measure, subject to data availability and comparability.
