Health Priority Areas
Greater Hampton Roads Connects was originally championed by a group of healthcare professionals, hospital administrators, and public health officials. These partners united around a common goal to have their individual organizations use a common data source to inform their work in community engagement. As health partners convened around shared indicators, GHRconnects contributed to the creation of Community Health Needs Assessments and Improvement Plans throughout the region. Over the years, stakeholders and coalitions across multiple domains have contributed their expertise to the site, resulting in cross-sector collaborations who target their efforts on specific health priorities.
The current shared priorities for our region are presented here, defined by the extensive work and support of our stakeholders and community members throughout Greater Hampton Roads. Below, you can find relevant data from our Community Indicators Dashboard and information on related community initiatives that are working to move the needle on health outcomes. For additional data on health indicators, including data by census tract, zip code, and county, please visit our Community Dashboard.
The contributors and supporters of GHRconnects recognizes the importance of the social determinants of health, and relevant data, initiatives, and priority areas can also be found on our other topics pages: Economy, Education, Natural and Built Environment, and Social Environment.
GHRconnects thrives on the contributions of our supporters-- if you have additions to our health priorities, please submit your recommendations on the Contact Us page.
1.1: Increase the number of residents covered by quality health insurance
Click the drop-down menu below to view information for specific cities or counties.
91.2%


This indicator shows the percentage of adults aged 18-64 years that have any type of health insurance coverage.
Data Source: U.S. Census Bureau - Small Area Health Insurance Estimates

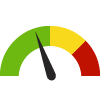
1.2: Increase access to providers (Primary Care)
View our most up-to-date Primary Care Provider rates (per 100,000 residents) to the left.
You can also view our Regional Primary Care Provider Rate or view the Primary Care Provider Rate for additional cities/counties within our region. These indicator pages also show comparison rates to state and national values, and the change in values over time.
1.2: Increase access to providers (Dentists)
View our most up-to-date Dentist rates (per 100,000 residents) to the right.
View data for additional cities and counties in our region on the Dentist Rate indicator page, where you can click on a location and find additional information including change over time and comparisons to state and national values.
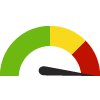
1.2: Increase access to providers (Mental Health)
View our most up-to-date Mental Health Care Provider rates (per 100,000 residents) to the left. The data on providers includes psychiatrists, psychologist, licensed clinical social workers, counselors, marriage and family therapists, and mental health providers who treat alcohol and drug abuse.
You can also view our Regional Mental Health Care Provider Rate or view the Mental Health Care Provider Rate for additional cities/counties within our region. These indicator pages also show comparison rates to state and national values, and the change in values over time.
2.1: Increase the number of children born at a healthy weight
Click the drop-down menu below to view information for specific cities or counties.


This indicator shows the percentage of births in which the newborn weighed less than 2,500 grams (5 pounds, 8 ounces).
Data Source: Virginia Department of Health, Division of Health Statistics
2.2: Decrease the number of adults with diabetes


This indicator shows the percentage of adults aged 20 and older who have ever been diagnosed with diabetes.
Women who were diagnosed with diabetes only during the course of their pregnancy were not included.
Data Source: Centers for Disease Control and Prevention
Local Success: Diabetes Prevention Project
Healthy Portsmouth: Multiple partners of the coalition worked together on this shared local priority.The Diabetes Prevention Project was operated by the YMCA of Portsmouth, and Eastern Virginia Medical School led post-program focus groups with some participants to identify actionable themes. Many respondents gave positive reviews about their experience, reporting the class was enjoyable and beneficial in their lives.
|
“I learned a lot about eating, how to choose foods, and how much to eat at one time. They taught me self-control when it comes to eating. We had a chance to meet lots of different people, get their ideas and focus on improving health... I would walk to the classes and sometimes I’d catch the bus so transportation and long-term programming would be nice additions for future programming. I want to start going again. Since the program ended, I’ve been working out at home and eating smaller meals. ”
-Portsmouth Resident, male, age 57
|
3.1: Decrease use of tobacco products
Unable to display chart because the requested indicator could not be found.
3.3: Decrease teen pregnancy rate
View our most up-to-date Teen Pregnancy rates (per 1,000 females aged 15-17) to the right.
View data for additional cities and counties in our region on the Teen Pregnancy Rate indicator page, where you can click on a location and find additional information including change over time and comparisons to state and national values.
1.4: Decrease infant mortality rate
View our most up-to-date Infant Mortality rates (per 1,000 live births) to the left.
You can also view our Regional Mental Infant Mortality Rate or view the Infant Mortality Rate for additional cities/counties within our region. These indicator pages also show comparison rates to state and national values, breakout data based on race/ethnicity, and the change in values over time.